Follow eufisica

Follow eufisica

Showing posts with label sun. Show all posts

Friday, September 16, 2016

Solar prominence

Image credit: NASA

Do you want to know what is a solar prominence?
Check this video from NASA.

Monday, September 5, 2016

Our solar system in cm


In this new school year we can start to push students heads in how to calculate the distance of each planet to our Sun and the respective size.

Well, my fellow colleagues I prepared a spreadsheet.


You can download the spreadsheet from here: http://goo.gl/c6f6WM

Sunday, December 22, 2013

The Sun's Magnetic Field is About to Flip.

The sun's magnetic field changes polarity approximately every 11 years.  It happens at the peak of each solar cycle as the sun's inner magnetic dynamo re-organizes itself.  
A reversal of the sun's magnetic field is, literally, a big event. The domain of the sun's magnetic influence (also known as the "heliosphere") extends billions of kilometers beyond Pluto. Changes to the field's polarity ripple all the way out to the Voyager probes, on the doorstep of interstellar space.
An artist's concept of the heliospheric current sheet.
An artist's concept of the heliospheric current sheet, which becomes more wavy when the sun's magnetic field flips.
When solar physicists talk about solar field reversals, their conversation often centers on the "current sheet."  The current sheet is a sprawling surface jutting outward from the sun's equator where the sun's slowly rotating magnetic field induces an electrical current.  The current itself is small, only one ten-billionth of an amp per square meter (0.0000000001 amps/m2), but there’s a lot of it: the amperage flows through a region 10,000 km thick and billions of kilometers wide.  Electrically speaking, the entire heliosphere is organized around this enormous sheet.
During field reversals, the current sheet becomes very wavy. 
Cosmic rays are also affected. These are high-energy particles accelerated to nearly light speed by supernova explosions and other violent events in the galaxy. 
"The sun's north pole has already changed sign, while the south pole is racing to catch up," Scherrer said. "Soon, however, both poles will be reversed, and the second half of solar max will be underway."
Source: NASA


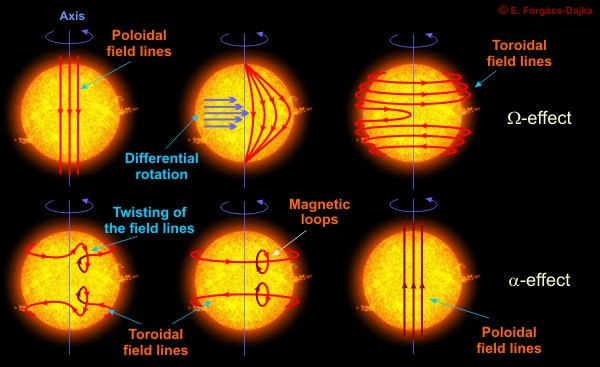
"The changing magnetic field is described by dynamo models: the rotation takes effect on the convective envelope and the result is the surface differential rotation, when the angular rotation has an equator-to-pole gradient. Differential rotation acts on the primordial poloidal field, and starts to build up a toroidal one (see the figure). Under the surface, somewhere at the bottom of the convective zone, this spin up effect streches, thus reinforces the toroidal field until it becomes an unstable state, when the buoyant force begins to act on them. Thus, the toroidal magnetic field arranged in vast flux tubes begins to emerge and reaches the solar surface. At this time, a typical magnetic feature appears: a magnetic loop, with a cool bipolar spot pair at the footpoints. The large scale meridional convection works just the opposite: somehow (that we do not understand clearly) it regenerates the poloidal field, transporting the emerging flux towards the poles. Finally, this process results in a poloidal field, similar to that we had at the beginning, but the polarity is now the opposite in sign."
Source: http://www.konkoly.hu/solstart/stellar_activity.html

Wednesday, April 24, 2013

NASA | SDO: Three Years of Sun in Three Minutes


Three years of Sun in three minutes
In the three years since it first provided images of the sun in the spring of 2010, NASA's Solar Dynamics Observatory (SDO) has had virtually unbroken coverage of the sun's rise toward solar maximum, the peak of solar activity in its regular 11-year cycle. This video shows those three years of the sun at a pace of two images per day.
SDO's Atmospheric Imaging Assembly (AIA) captures a shot of the sun every 12 seconds in 10 different wavelengths. The images shown here are based on a wavelength of 171 Angstroms, which is in the extreme ultraviolet range and shows solar material at around 600,000 Kelvin. In this wavelength it is easy to see the sun's 25-day rotation as well as how solar activity has increased over three years.

During the course of the video, the sun subtly increases and decreases in apparent size. This is because the distance between the SDO spacecraft and the sun varies over time. The image is, however, remarkably consistent and stable despite the fact that SDO orbits the Earth at 6,876 miles per hour and the Earth orbits the sun at 67,062 miles per hour.

Such stability is crucial for scientists, who use SDO to learn more about our closest star. These images have regularly caught solar flares and coronal mass ejections in the act, types of space weather that can send radiation and solar material toward Earth and interfere with satellites in space. SDO's glimpses into the violent dance on the sun help scientists understand what causes these giant explosions -- with the hopes of some day improving our ability to predict this space weather.
There are several noteworthy events that appear briefly in this video. They include the two partial eclipses of the sun by the moon, two roll maneuvers, the largest flare of this solar cycle, comet Lovejoy, and the transit of Venus. The specific time for each event is listed below, but a sharp-eyed observer may see some while the video is playing.

00:30;24 Partial eclipse by the moon

00:31;16 Roll maneuver

01:11;02 August 9, 2011 X6.9 Flare, currently the largest of this solar cycle

01:28;07 Comet Lovejoy, December 15, 2011

01:42;29 Roll Maneuver

01:51;07 Transit of Venus, June 5, 2012

02:28;13 Partial eclipse by the moon

More information about this video, as well as full HD version of all four wavelengths and print-resolution stills are public domain and can be viewed and downloaded at: http://svs.gsfc.nasa.gov/vis/a010000/...

This video is public domain and can be downloaded.

Sunday, November 11, 2012

Gradient Sun

The images in this video shows an unfiltered image from the sun next to one that has been processed using a gradient filter. Note how the coronal loops are sharp and defined, making them all the more easy to study. On the other hand, gradients also make great art. Watch the video to see how the sharp loops on the sun next to the more fuzzy areas in the lower solar atmosphere provide a dazzling show.

Saturday, June 9, 2012


After the Venus transit let me present you a challenge.
Transit of the planets is a way to discover another planets (exoplanets) in distant stars.
Credit: Astromic Backyard
Venus is almost the same size of our planet. So, how many Earths could be inside our Sun, if could be that possible?
Let's assume that Earth, by approximation, is a little sphere that we going to put inside a giant sphere, our Sun.
To calculate how many our Sun is large in volume than our Earth, we find the relation between both astronomical objects. So, we can establish the volume ratio between Sun and Earth:
VSun = X x VEarth ↔ X = VSun / VEarth    [1]
The sphere's volume can be calculated using the mathematical expression 
4/3 π R3
Thus, applied in the equation [1] brings:
X = (4/3 π R3Sun) / (4/3 π R3Earth) ↔  X = (R3Sun) / (R3Earth)     [2]
We can find the Sun and Earth radius values in Wikipedia:
R(Sun) = 6,955×105 km       e        R(Earth) = 6 378,1 km
Credit: NASA
Replacing in equation [2] and solving, we obtain:
X = (R3Sun) / (R3Earth)   ↔   X = (6,955×105)3 / (6 378,1)3   ↔  X = 1 296 634,0
That result means that our Sun is more than one million times largest than Earth. Thus, we can put about 1,3 x 10⁶ Earths inside our Sun!

Here is a playlist with videos about stars, Solar System and more.


Tuesday, May 22, 2012

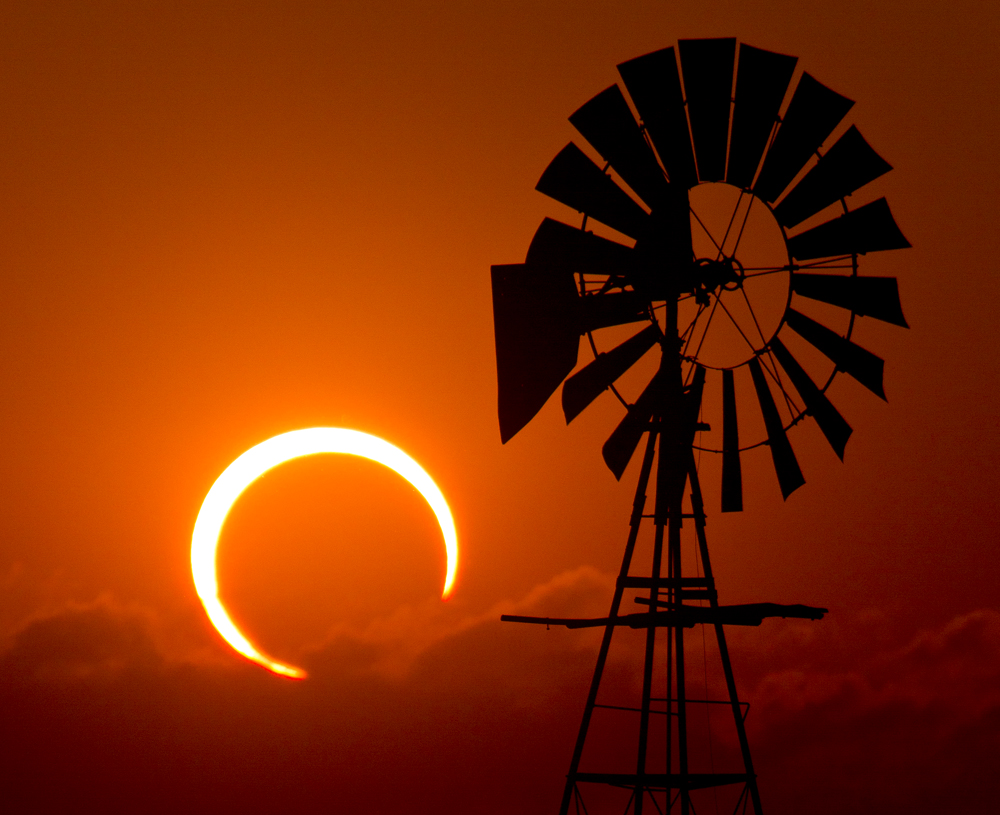
Annular Solar Eclipse, May 2012

Watch this images and videos about the Annular Solar Eclipse occurred last Sunday.

Saturday, May 19, 2012

Friday, May 11, 2012

Look at the Sun


The science behind observing our star


The governing laws
The motion of objects is governed by Newton's laws. The same simple laws that govern the motion of objects on earth also extend to the motion of planets, moons, and other satellites. The mathematics that describes a satellite's motion is the same mathematics presented for circular motion described here.
So, the velocity, acceleration and ratio between period and radius can be acquired.
The period, speed and acceleration of a satellite are only dependent upon the radius of orbit and the mass of the central body that the satellite is orbiting.


The Lagrangian points [1]

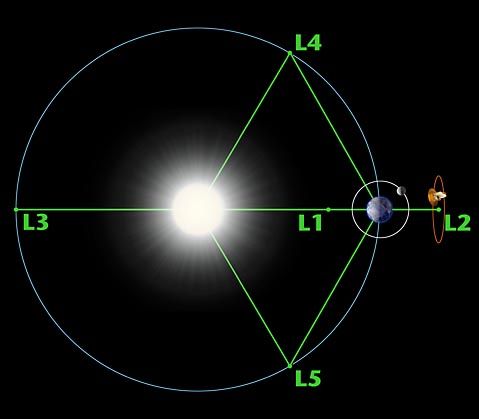
The Lagrangian points are the five positions in an orbital configuration where a small object affected only by gravity can theoretically be stationary relative to two larger objects (such as a satellite with respect to the Earth and Moon). The Lagrange points mark positions where the combined gravitational pull of the two large masses provides precisely the centripetal force required to rotate with them.
Lagrangian points are the stationary solutions of the circular restricted three-body problem. For example, given two massive bodies in circular orbits around their common center of mass, there are five positions in space where a third body, of comparatively negligible mass, could be placed so as to maintain its position relative to the two massive bodies. As seen in a rotating reference frame with the same period as the two co-orbiting bodies, the gravitational fields of two massive bodies combined with the satellite's circular motion are in balance at the Lagrangian points, allowing the third body to be stationary with respect to the first two bodies.

There is an individual description of lagrangian points in ESA website. 

STEREO and SOHO
Two of the most important satellites that are observing our Sun is STEREO and SOHO
STEREO (Solar TErrestrial RElations Observatory) is the third mission in NASA's Solar Terrestrial Probes program (STP). The mission, launched in October 2006, has provided a unique and revolutionary view of the Sun-Earth System. The two nearly identical observatories - one ahead of Earth in its orbit, the other trailing behind - have traced the flow of energy and matter from the Sun to Earth. STEREO has revealed the 3D structure of coronal mass ejections; violent eruptions of matter from the sun that can disrupt satellites and power grids, and help us understand why they happen. STEREO is a key addition to the fleet of space weather detection satellites by providing more accurate alerts for the arrival time of Earth-directed solar ejections with its unique side-viewing perspective. (NASA)
SOHO, the Solar & Heliospheric Observatory, is a project of international collaboration between ESA and NASA to study the Sun from its deep core to the outer corona and the solar wind. (NASA)

Now lets watch trajectories and lagrange points in action [2]:


[1] text from wikipedia: http://en.wikipedia.org/wiki/Lagrangian_point (May 11, 2012)
[2] video shared by my friend Manel Rosa Martins.

Friday, March 30, 2012

Solar tornado

The hot gases in the tornadoes have speeds as high as 300,000 km per hour. Gas speeds of terrestrial tornadoes can reach 150km per hour.

(PhysOrg.com) -- Solar tornadoes several times as wide as the Earth can be generated in the solar atmosphere, say researchers in the UK. A solar tornado was discovered using the Atmospheric Imaging Assembly telescope on board the Solar Dynamic Observatory (SDO) satellite. A movie of the tornado will be presented at the National Astronomy Meeting 2012 in Manchester on Thursday 29th March.


Wednesday, March 14, 2012

Great Sun spot

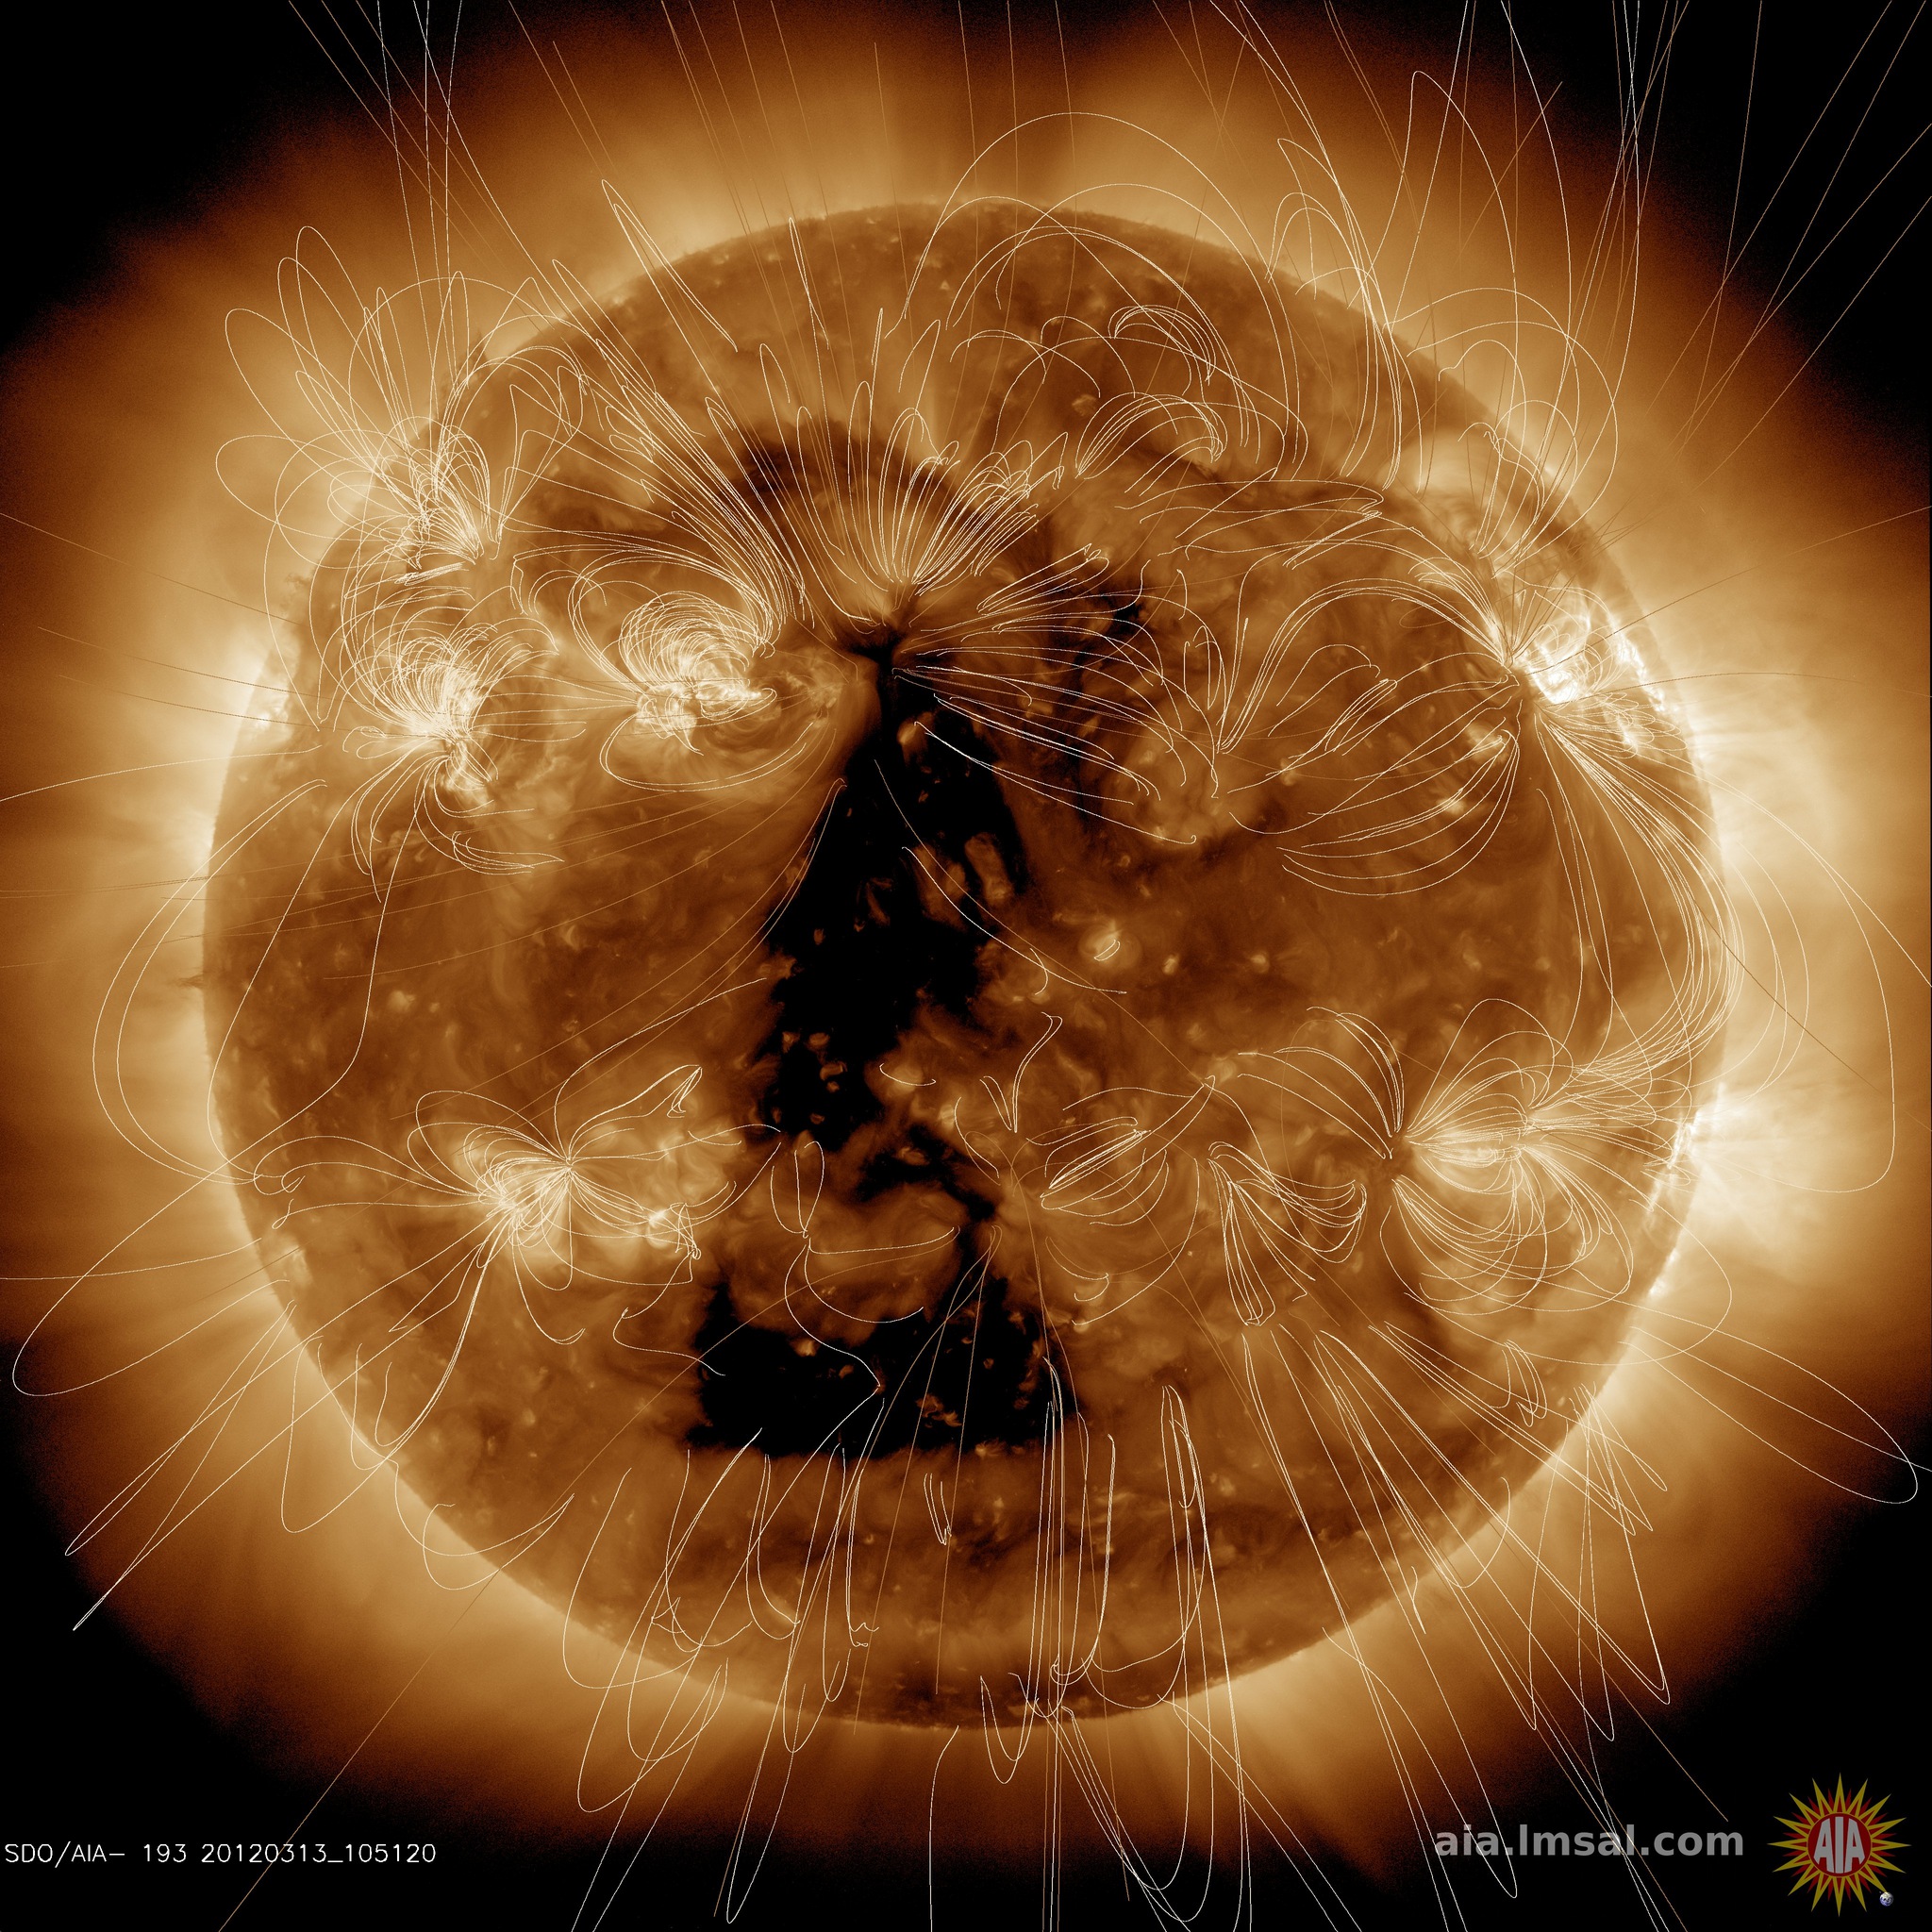
The Solar Dynamics Observatory has been witnessing the last days of the slow movement of a large coronal hole above the surface of the Sun. That hole is opening its huge presence of a gap in the structure of the magnetic field of the crown, allowing the escape of a rapid and dense flow of charged particles into interplanetary space. At this time, the coronal hole is directed towards the Earth, so that an expected increase in activity over the next days due to geomagnetic interaction with the terrestrial magnetic field, will be intense because solar wind. 
Coronal hole observed yesterday by Solar Dynamics Observatory in the ultraviolet extreme region (193 Å). It's also represented the magnetic field lines in the coronal solar (representation obtained from the calculus in the base model PFSS).
Credit: SDO(NASA)/AIA consortium/Helioviewer. 
The plasma density inside the coronal holes is typically 100 times lower than other regions of the crown. Typically, the gas crown is superheated to temperatures exceeding one million °C, that makes them particularly bright on the images taken in the extreme ultraviolet band. Because of their low density, coronal holes are relatively cool and therefore darker in the area of the electromagnetic spectrum.
During periods of low solar activity, coronal holes tend to be confined to the polar regions of the Sun to occur at lower latitudes will become more common as the solar cycle approaches its peak, so its presence these regions of the solar disk at this stage of the current cycle is a perfectly normal phenomenon. 

translated from astropt.org

Angry Sun Erupting 
Image Credit & Copyright: Alan Friedman (Averted Imagination) 
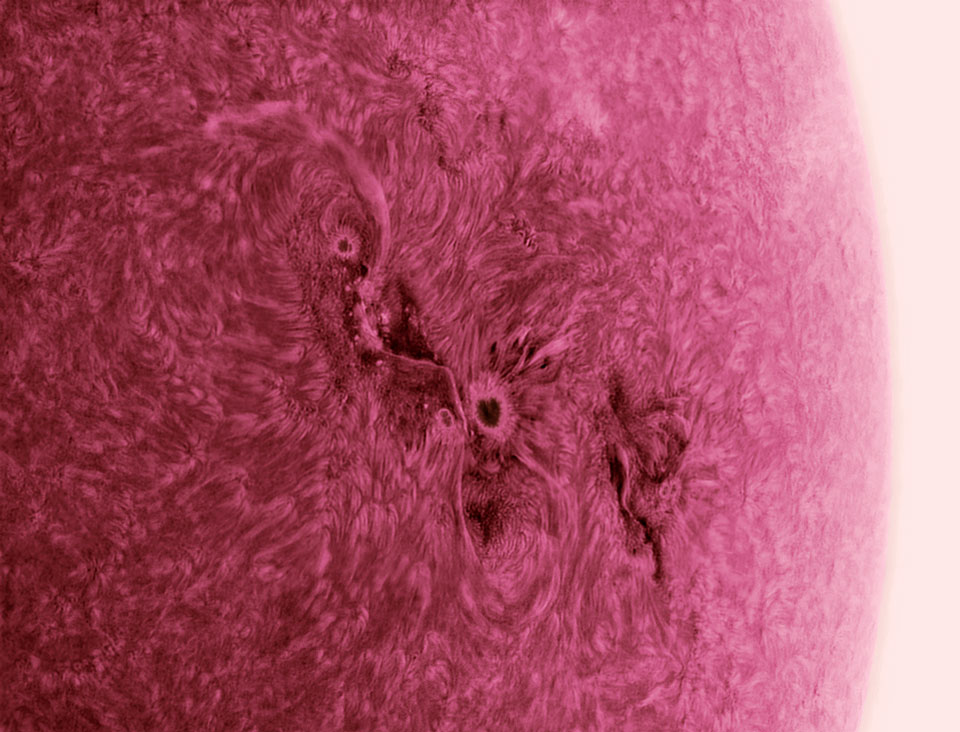
Explanation: It's one of the baddest sunspot regions in years. Active Region 1429 may not only look, to some, like an angry bird -- it has thrown off some of the most powerful flares and coronal mass ejections of the current solar cycle. The extended plumes from these explosions have even rained particles on the Earth's magnetosphere that have resulted in colorful aurorasPictured above, AR 1429 was captured in great detail in the Sun's chromosphere three days ago by isolating a color of light emitted primarily by hydrogen. The resulting image is shown in inverted false color with dark regions being the brightest and hottest. Giant magnetically-channeled tubes of hot gas, some longer than the Earth, are known as spicules and can be seen carpeting the chromosphere. The light tendril just above AR 1429 is a cool filament hovering just over the active sunspot region. As solar maximum nears in the next few years, the increasingly wound and twisted magnetic field of the Sun may create even more furious active regions that chirp even more energetic puffs of solar plasma into our Solar System. 
in APOD

Tuesday, January 31, 2012

Human activity, solar activity and global warming

A graph of the sun's total solar irradiance shows that in recent years irradiance dipped to the lowest levels recorded during the satellite era. The resulting reduction in the amount of solar energy available to affect Earth's climate was about .25 watts per square meter, less than half of Earth's total energy imbalance. Credit: NASA/James Hansen
A new NASA study underscores the fact that greenhouse gases generated by human activity -- not changes in solar activity -- are the primary force driving global warming.


A new NASA study underscores the fact that greenhouse gases generated by human activity -- not changes in solar activity -- are the primary force driving global warming.

"The fact that we still see a positive imbalance despite the prolonged solar minimum isn't a surprise given what we've learned about the climate system, but it's worth noting because this provides unequivocal evidence that the sun is not the dominant driver of ," Hansen said.

Hansen's team concluded that Earth has absorbed more than half a watt more solar energy per square meter than it let off throughout the six year study period. The calculated value of the imbalance (0.58 watts of excess energy per square meter) is more than twice as much as the reduction in the amount of solar energy supplied to the planet between maximum and minimum solar activity (0.25 watts per square meter).

According to calculations conducted by Hansen and his colleagues, the 0.58 watts per square meter imbalance implies that carbon dioxide levels need to be reduced to about 350 parts per million to restore the energy budget to equilibrium. The most recent measurements show that carbon dioxide levels are currently 392 parts per million and scientists expect that concentration to continue to rise in the future.
in NASA

Sunday, January 29, 2012

Mesmerizing loops of magnetism on the Sun

Clean Space Junk with the Sun

An illustration of debris in space.
An artist's impression of Earth surrounded by space junk.
Illustration by Photo Researchers/Getty Images

The recent uptick in solar flares and other activity on the sun could one day cripple satellites or knock out power grids on Earth. But in the meantime, the solar maelstrom has been helping to clear out space junk, NASA scientists report.
in National Geographic

Friday, July 15, 2011

Measuring the Earth-Sun distance during a lunar eclipse

Lunar Eclipse. Credit: Fred Espenak


The classical method for measure the Earth-Sun distance is due to Aristarchus and it is based upon the measure of the angle Moon-Earth-Sun when the Moon is exactly in quadrature. [...]
Comments:3 pages, 2 figures. Proc. of "Einstein 120" conference, Kyrgyz State University, 12 September 1999, Bishkek, Kyrghizsthan
Subjects:Instrumentation and Methods for Astrophysics (astro-ph.IM); History and Philosophy of Physics (physics.hist-ph)
Journal reference:"Einstein 120" conference,V. Gurovich ed., Kyrgyz State University, Bishkek, Kyrghizsthan, 2000
Cite as:arXiv:1107.0836v1 [astro-ph.IM]

Saturday, June 25, 2011

Tuesday, June 21, 2011

Evidence for a new Planetary System

Astronomers find evidence for a strange new planetary system


Astronomers find evidence for a strange new planetary system
(PhysOrg.com) -- A team of astronomers, including Dr Gavin Ramsay of the Armagh Observatory, has found evidence that suggests the existence of an extraordinary planetary system. Two giant planets appear to be revolving at some distance around a compact, interacting stellar binary known as UZ For, which comprises two small stars orbiting very closely one about the other.

Read complete article in PhysOrg.

Spectacular Blast from June 7, 2011 [HD Video]

Featured Post

IBSE about Light Pollution

Here is my presentation that happened in the Discover the Cosmos Conference (Volos, Greece - 2013). The presentation was an Inquiry Base...

Popular Posts